Taro小程序引入Echarts教程

小程序需要添加简单的数据统计功能。因为对Echats比较熟悉,所以想将Echats引入到项目中,有几点注意事项,记录一下。

taro版本:3.3.2(注意一下版本信息),官方物料仓库里面的Echarts大多不兼容最新版本taro框架,但是实现的思路都是一样的。大致说一下:

准备工作
  1. 下载Echarts官方的小程序插件echarts-for-weixin 传送门
    在这里插入图片描述

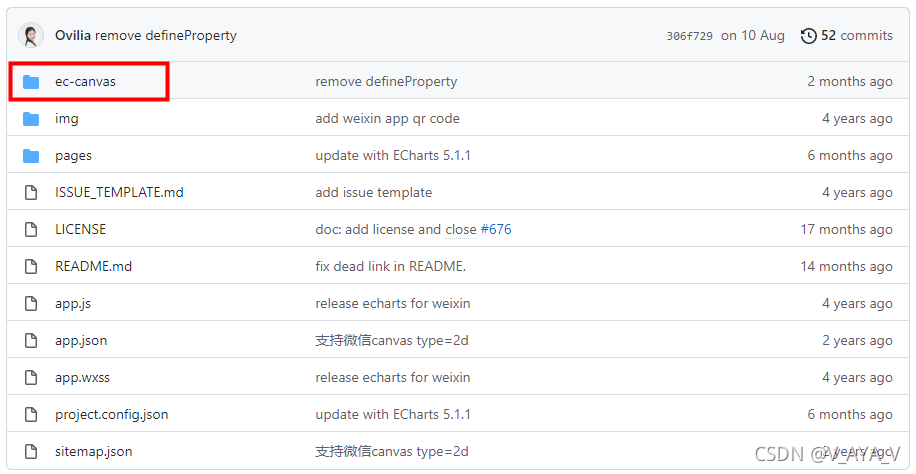
  2. 将项目中的ec-canvas文件夹复制保存

  3. 去Echarts官网定制图表(不建议全部下载,文件太大,小程序体积大需要分包) 传送门

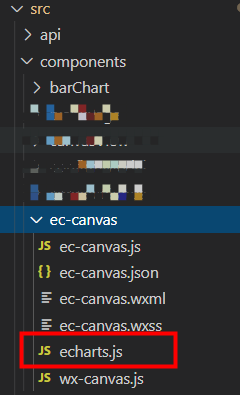
  4. 压缩echarts.js文件(压缩方法可以自行找线上压缩网站或自行压缩,方法附后文)

  5. 替换ec-canvas文件中的echarts.js文件
    在这里插入图片描述

    本地压缩方法
1
2
npm install uglify-js -g
uglifyjs echarts.js -m -o echarts.min.js //注意:替换ec-canvas里面的文件时将echarts.min.js换回来
小程序封装图表组件(以柱状图为例)
1
2
3
4
5
6
7
8
9
10
11
12
13
14
15
16
17
18
19
20
21
22
23
24
25
26
27
28
29
30
31
32
33
34
35
36
37
38
39
40
41
42
43
44
45
46
47
48
49
50
51
52
53
54
55
56
57
58
59
60
61
62
63
64
65
// 柱状图
import { Component } from "react";
import { View } from "@tarojs/components";
import { getCurrentInstance } from "@tarojs/taro" //Taro3.x需要使用getCurrentInstance 获取页面DOM

import './index.scss'

function setChartData(chart){
const defautOption = {
xAxis: {
type: "category",
data: ["Mon", "Tue", "Wed", "Thu", "Fri", "Sat", "Sun"],
},
yAxis: {
type: "value",
},
series: [
{
data: [120, 200, 150, 80, 70, 110, 130],
type: "bar",
showBackground: true,
backgroundStyle: {
color: "rgba(220, 220, 220, 0.8)",
},
},
],
};
chart.setOption(defautOption);
}

export default class BarChart extends Component {
constructor(props) {
super(props)
this.state = {
ec: {
lazyLoad: true
}
}
}
componentDidMount() {
}

refresh(data) {
getCurrentInstance().page.selectComponent('#mychart-area').init((canvas, width, height) => {
const chart = echarts.init(canvas, null, {
width: width,
height: height
});
setChartData(chart, data);
return chart;
});
}

render() {
return (
<View className='bar-chart'>
<ec-canvas
id='mychart-area'
canvasId='mychart-area'
ec={this.state.ec}
/>
</View>
);
}
}
页面使用
1
2
3
4
5
6
7
8
9
10
11
12
13
14
15
16
17
18
19
20
21
22
23
24
25
26
27
28
29
30
31
32
33
34
35
36
37
38
import React, { Component } from 'react'
import { View } from '@tarojs/components'
import BarChart from '@/components/barChart'

import './index.scss'

export default class Index extends Component {
constructor (props) {
super(props)
this.barChart = React.createRef()
this.state = {
}
}

componentWillMount () { }

componentDidMount () {
// 延迟调用,确保 ec-canvas 节点已存在
setTimeout(() => {
this.barChart.current.refresh()
}, 100)
}

componentWillUnmount () { }

componentDidShow () { }

componentDidHide () { }

render () {
return (
<View className='selfstudy-container'>
<BarChart ref={this.barChart} />
</View>
)
}
}

——————————————————至此图表引入已完成90%————————————————————-
直接页面使用的话会报两个错误:

  1. echarts is not defined。(没有拿到ec-canvas页面实例)
    在这里插入图片描述

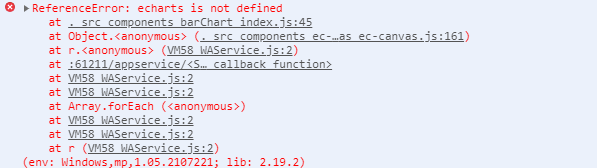
解决方法:在 app 或页面配置文件中配置 usingComponents 属性。

1
2
3
4
5
6
7
8
export default {
usingComponents: {
// 定义需要引入的第三方组件
// 1. key 值指定第三方组件名字,以小写开头
// 2. value 值指定第三方组件 js 文件的相对路径
'ec-canvas': '../../components/ec-canvas/ec-canvas'
}
}

注意:Taro3 的组件是没有配置文件的,因此 usingComponents 必须配置在“页面”的配置文件中。
2. t.addEventListener is not a function
在这里插入图片描述
解决方法:在 ec-canvas文件夹下面的wx-canvas.js文件添加代码:
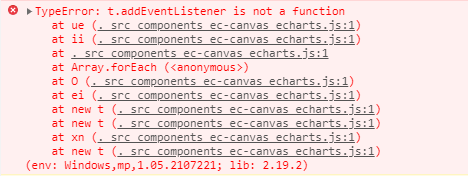
1
2
3
4
5
6
7
8
9
10
11
12
13
14
15
16
17
18
19
20
21
22
23
24
25
26
27
export default class WxCanvas {
constructor(ctx, canvasId, isNew, canvasNode) {
this.ctx = ctx;
this.canvasId = canvasId;
this.chart = null;
this.isNew = isNew
if (isNew) {
this.canvasNode = canvasNode;
}
else {
this._initStyle(ctx);
}

// this._initCanvas(zrender, ctx);

this._initEvent();
}

// 新增空函数,修复调用 echarts.init 时报错
addEventListener () {}

getContext(contextType) {
if (contextType === '2d') {
return this.ctx;
}
}
}